USDA Crop Progress: Corn Hits 13% Dough Stage
Thirteen percent of the US corn crop has reached dough stage, USDA's latest Crop Progress report shows, while soybeans continue pod setting.
- Entered
- Plot
- 1.5 ha
- Record
- 605 words
- Walk-through
- 3 min
DrillSprayHarvestCurrent stage
Agronomist’s notes
- USDA's weekly Crop Progress report put corn at 13% dough stage.
- Soybeans continued setting pods in the latest reporting week.
- The survey covers principal producing states and feeds price and yield models.
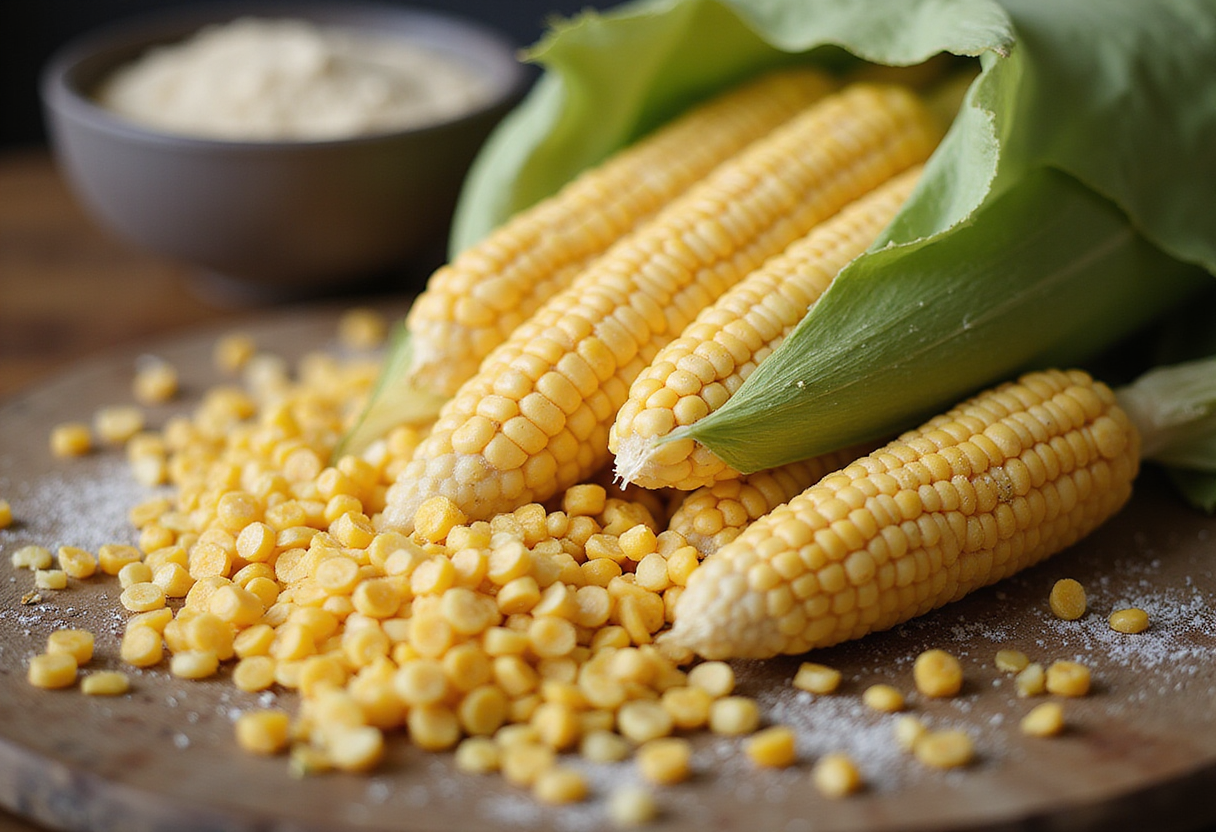
Thirteen percent of the US corn crop has reached dough stage. That's the headline number from the latest USDA Crop Progress report, the weekly federal survey that traders, agronomists and insurers watch every Monday during the growing season. Soybeans, meanwhile, continue setting pods across the principal producing states.
The dough stage is a reproductive milestone. Kernels shift from liquid to a pasty, dough-like consistency as starch accumulates — roughly the R4 stage on the standard corn development scale. It sits between pollination and dent, and it's the point where kernel depth gets locked in. When 13% of the national crop hits that benchmark, buyers start rebuilding yield models.
What does dough stage actually tell us?
Plenty. Corn that reaches dough on schedule has cleared pollination, the yield-sensitivity window where heat or drought does its worst damage. From here, each subsequent stage — dent at R5, maturity at R6 — narrows the range of possible outcomes. A crop at 13% dough in early August is broadly on a normal track.
The number matters most as a comparison point. Analysts will line up that 13% against the five-year average and last year's figure for the same week to judge whether the crop is ahead, behind or on pace. Ahead tends to mean earlier harvest pressure on basis and storage. Behind raises frost risk for late-planted acres.
For farmers, the practical read is simpler. A crop at dough is past the worst of the weather market. From this stage forward, each week of decent conditions converts potential into fill.
Why the soybean pod number drives the trade
The report confirmed soybeans are setting pods across the surveyed states. Pod setting — the R4 to R5 progression in soybeans — is when the plant decides how many of those pods actually fill. It's the crop's equivalent of corn's grain-fill window: moisture stress now shows up directly as fewer beans per pod and lighter seed weight.
Soybean yield is built in August. Pods per plant, seeds per pod, seed size — all three get finalized in the weeks after pod set begins. That's why a single sentence about pod setting in a Monday USDA report can move November futures on Tuesday morning.
How the survey works
USDA's National Agricultural Statistics Service compiles Crop Progress from reports submitted by farm-service contacts, county extension staff and other observers in the major producing states each week. State figures are weighted by planted acreage to produce the national percentages. It's judgment-based, not machine-measured — but it's the same methodology week to week and year to year, which is exactly what makes the trend lines usable.
What should growers watch next?
Three things in the coming weeks:
- Dent stage progression in corn. The share of the crop reaching dent — and how it stacks up against the five-year average — will signal harvest timing.
- Pod counts and dropping leaves in soybeans. Pod set gives way to leaf drop as maturity approaches; the pace of that transition frames harvest sequencing.
- Condition scores alongside stage data. Stage tells you timing. Condition ratings tell you fill quality. The two together move markets.
The next installment of the report lands Monday afternoon, as it does every week through the season. Corn dent percentages and the pod-setting figure for soybeans are the numbers to check first — they'll show whether this crop is accelerating toward an early combine run or holding to a standard calendar. (Note: this report summary carries only headline figures; readers should consult the full USDA release for state-level detail and condition ratings.)
— Daniel Okafor
via Google News: harvest report wheat (Source)
More from Daniel Okafor
Show full bio
Market editor covering money, funding and market shifts around production farming and field operations at Arable Wire.
109 articles
Nearby records
- TD 78USDA Crop Progress: Corn Reaches Dough Stage Ahead of AverageOctober 10, 2026
- ME 41Corn Reaches 16% Dented as Soybean Condition SlipsOctober 10, 2026
- GF 74US Corn Harvest 18% Complete, Soybeans at 12%September 30, 2026
- DB 33USDA Rates Corn 57% Good-to-Excellent, Soybeans 60%October 12, 2026
- WR 21USDA Crop Progress Shows Corn Condition Slipping AgainSeptember 29, 2026